
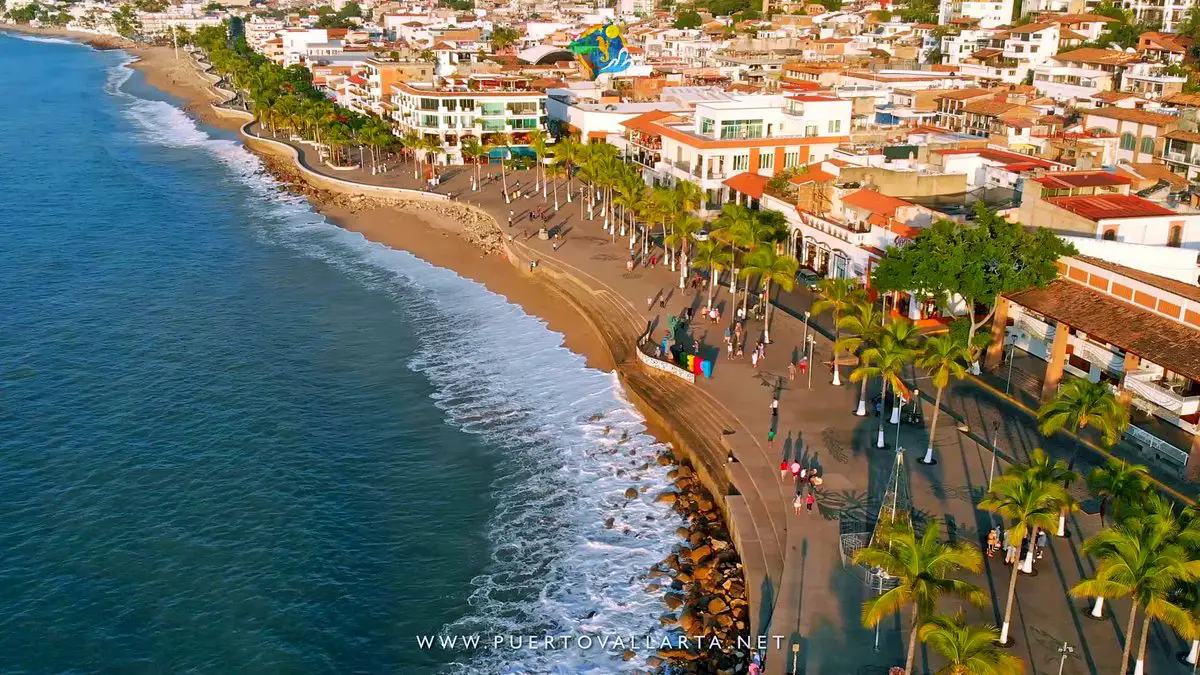
Puerto Vallarta sits on the Costa Dorada (Golden Coast) of Jalisco Mexico, at the mid-point of the large Banderas Bay, where the Pacific Ocean washes the beaches between the Mexican States of Jalisco and Nayarit.
Summary
- Puerto Vallarta has a tropical climate with both extreme wet seasons and dry seasons.
- Average highs run from about 77°F (25°C) in January to about 85°F (29°C) in July and August, thanks to the positioning of Puerto Vallarta.
- The rainy season runs from June through Mid-October, with virtually no precipitation the rest of the year.
- Even in rainy season, the rain normally falls in the late afternoon or evening, leaving the mornings and early afternoons sunny and clear.
- The best time of year to visit for hot-weather activities is from late April to early June.
- The dry season typically runs from November to May.
- Average lows run from about 64°F (18°C) in winter to about 76°F (24°C) in summer.
- The sea is usually calm in the morning and choppy in the afternoon, especially during the rainy season.
- The UV index is high year-round, so it is important to wear sunscreen and protective clothing.


Introduction
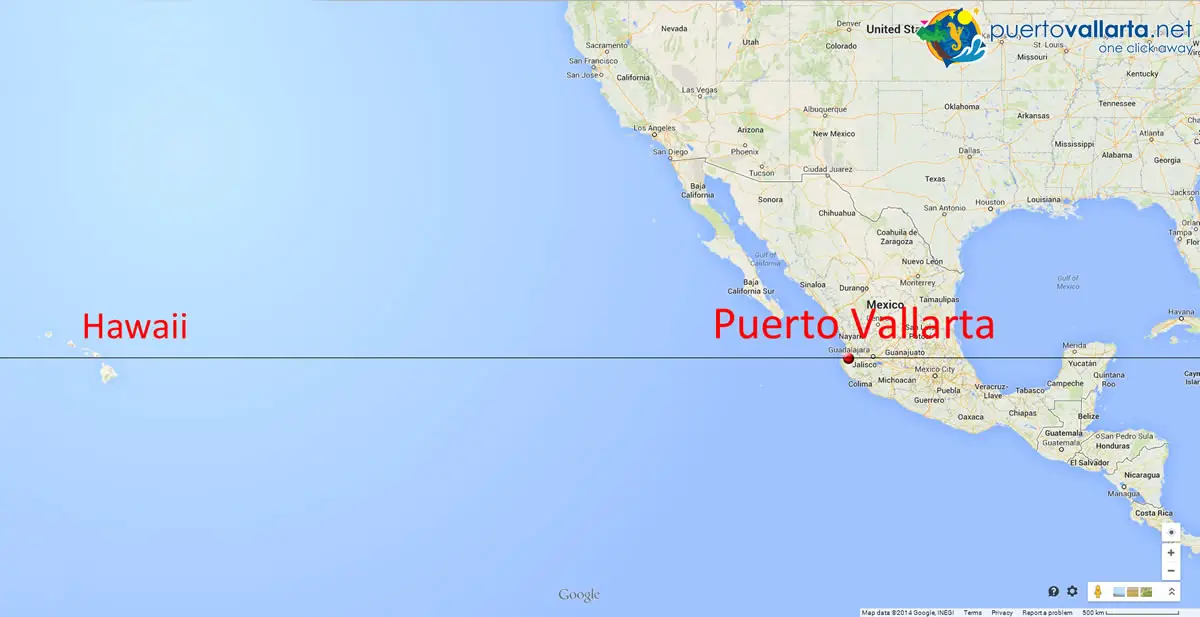
Puerto Vallarta and Hawaii on a map
Puerto Vallarta is located on the same latitude as the Hawaiian islands (20ºN), that’s why the city’s weather and climate are often compared to Hawaii’s own (PV city info).
Puerto Vallarta (as well as Nuevo Vallarta) is surrounded by jungle and receives considerable rain during the wet summer months.
Vallarta’s climate has very distinct dry and wet seasons during the year. In general, the Summer months have a much higher chance of rain than the Winter months, which are mostly dry.
💡 Expert Tip: When checking the Puerto Vallarta weather, remember that the region has a distinct dry season (November to May) and a wet season (June to October). If you travel during the summer wet season, do not worry; it typically only rains in short and spectacular downpours in the late afternoon or evening, leaving the rest of the day perfectly sunny and warm for beach activities!
Today’s Forecast
Do note that during the rainy season (June to mid-October) you’ll see forecasts showing clouds, rain and lightning, but this is normally something that occurs only in the late afternoon and night. Sometimes there are storms in the area and that can mean cloudy skies that stay all day long.
So whenever you are in doubt, take advantage of the webcams in Puerto Vallarta and check the weather in real-time
Generalities
- Tropical wet and dry (Köppen Climate classification)
- Rainy Wet Season: June to September, most rain in September. It rains intermittently during the partly cloudy day, around an hour in total, at most.
- December, January, and February (high dry season) are warm and sunny.
- Spring and Autumn offer moderate temperatures.
- Over the year, the average high is about 81°F (27°C) and the average low about 70°F (21°C).
- Hurricanes seldom strike Puerto Vallarta, the last significant events were Kenna (2002) and Lily (1971) before that one.
While rain can spoil a day at the beach, tropical storms can be quite beautiful and amazing, when rain seems to march across the hills and lightning illuminates the humid sky while the thick clouds advance inland from the Bay.
Runoff from the rains in the jungle and hills can turn the seawater brown in some areas, mainly around rivers and streams, detracting somewhat from the beauty of the beaches and the bay. In July and August average highs are about 85°F (29°C), and the humidity can add to the perception of heat. These are averages for an area that includes some sea, so downtown on a still afternoon can feel hotter.
During the winter, the local weather changes significantly, and average highs are about 77 to 78°F (25 to 26°C), quite comfortable for a stroll on the beach and around town. Nighttime temperatures in Puerto Vallarta and Nuevo Vallarta range from about 64°F (18°C) in winter to about 76°F (24°C) in summer.
See PV now, use the webcam
Puerto Vallarta Seasons
The seasons in Puerto Vallarta are always from warm to hot and there is a distinct rainy season (June to mid-October) and a dry season (last half of October to May).
- Winter: December 22 to March 21
- Spring: March 22 to June 21
- Summer: June 22 to September 21
- Autumn: September 22 to December 21
About the Rainy Season
IMPORTANT:
Many think that rain in Puerto Vallarta’s wet season means it rains all day and every day, that’s not the case.
During the wet season, it may rain a bit in the morning, a bit during the day and then most of it during the night. It’s intermittent and for short runs, it doesn’t get in the way of touring and enjoying the area.
It is actually a blessing as temperatures actually go down during what is the warmest period of the year.
Weather Data
Puerto Vallarta climate by month
Interactive chart loading: monthly highs and lows, sea temperature, rainfall, days with any rain (1 mm or more) and humidity for Puerto Vallarta and Sayulita, with 1991 to 2020 normals and the last 12 months.
Puerto Vallarta weather month by month
Average highs, lows, rain and sea temperature for each month, from the same data as the chart above.
January
- High77°F 25°C
- Low64°F 18°C
- Rain1.1 in 29 mm
- 3 days with any rain (1 mm or more)
- Sea77°F 25°C
Mild days, cool nights.
Pack: light clothes and a light layer for the evenings.
February
- High77°F 25°C
- Low64°F 18°C
- Rain0.9 in 24 mm
- 3 days with any rain (1 mm or more)
- Sea76°F 24°C
Mild days, cool nights.
Pack: light clothes and a light layer for the evenings.
March
- High78°F 26°C
- Low65°F 18°C
- Rain0.4 in 10 mm
- 1 day with any rain (1 mm or more)
- Sea75°F 24°C
Mild days, cool nights, coolest sea of the year.
Pack: light clothes and a light layer for the evenings.
April
- High80°F 27°C
- Low67°F 19°C
- Rain0.1 in 4 mm
- 1 day with any rain (1 mm or more)
- Sea76°F 24°C
Warm and dry, driest month.
Pack: light clothes.
May
- High83°F 28°C
- Low71°F 22°C
- Rain0.4 in 9 mm
- 2 days with any rain (1 mm or more)
- Sea79°F 26°C
Warm and dry.
Pack: light clothes.
June
- High84°F 29°C
- Low75°F 24°C
- Rain6.9 in 176 mm
- 17 days with any rain (1 mm or more)
- Sea82°F 28°C
Hot, humid and rainy.
Pack: light clothes and a rain jacket or umbrella.
July
- High85°F 29°C
- Low76°F 24°C
- Rain10.2 in 260 mm
- 27 days with any rain (1 mm or more)
- Sea85°F 30°C
Hot, humid and rainy.
Pack: light clothes and a rain jacket or umbrella.
August
- High85°F 29°C
- Low76°F 24°C
- Rain13.4 in 341 mm
- 29 days with any rain (1 mm or more)
- Sea86°F 30°C
Hot, humid and rainy, warmest sea of the year.
Pack: light clothes and a rain jacket or umbrella.
September
- High84°F 29°C
- Low76°F 24°C
- Rain13.6 in 345 mm
- 28 days with any rain (1 mm or more)
- Sea86°F 30°C
Hot, humid and rainy, wettest month.
Pack: light clothes and a rain jacket or umbrella.
October
- High84°F 29°C
- Low74°F 23°C
- Rain6.0 in 153 mm
- 18 days with any rain (1 mm or more)
- Sea85°F 30°C
Hot, humid and rainy.
Pack: light clothes and a rain jacket or umbrella.
November
- High82°F 28°C
- Low70°F 21°C
- Rain1.3 in 33 mm
- 5 days with any rain (1 mm or more)
- Sea83°F 28°C
Warm, with some rain on a few days.
Pack: light clothes and a small umbrella just in case.
December
- High78°F 26°C
- Low65°F 19°C
- Rain1.0 in 24 mm
- 3 days with any rain (1 mm or more)
- Sea79°F 26°C
Mild days, cool nights.
Pack: light clothes and a light layer for the evenings.
All figures are averages for a 25 km area that includes some sea, so downtown on a still, sunny afternoon can feel hotter than these numbers. In the rainy season most days get at least some rain, usually a storm in the late afternoon or at night, not rain all day.
Air and rain: Copernicus ERA5, 1991 to 2020 normals (contains modified Copernicus Climate Change Service information). Sea: NOAA OISST v2.1, 1991 to 2020.
Weather Forecasts for PV
- Weather Forecast Map (Weather Underground)
Current Weather Conditions and Three Day Forecast for Vallarta. - AccuWeather (Weather Maps & Forecast for PV)
Another reliable weather data and forecast site.
Satellite Images
- Satellite view Weather.com
- Eastern Pacific Visible Satellite NOAA for cloud cover
- Collection of satellite images by Mexico Weather Stations (SMN)
Storm Warnings and Tracking
- National Hurricane Center
- Tropical Weather Outlook Data Sources for the Eastern Pacific
- Hurricane Central & Cyclone Warnings Mexican Meteorological Service
Other Weather Related Links
- Tide Predictor Great data for sailors and surfers
- Puerto Vallarta Mexico average water temperature / external
- Wind Speed (miles per hour) & Tide Predictor
- Satellite Image of the World from Space zoom and pan available
- Vallarta Mexico Weather and Radar Maps
- Jet Stream Analyses (North America – Part of Mexico)
- Local time / Time Zones / Daylight Saving Time

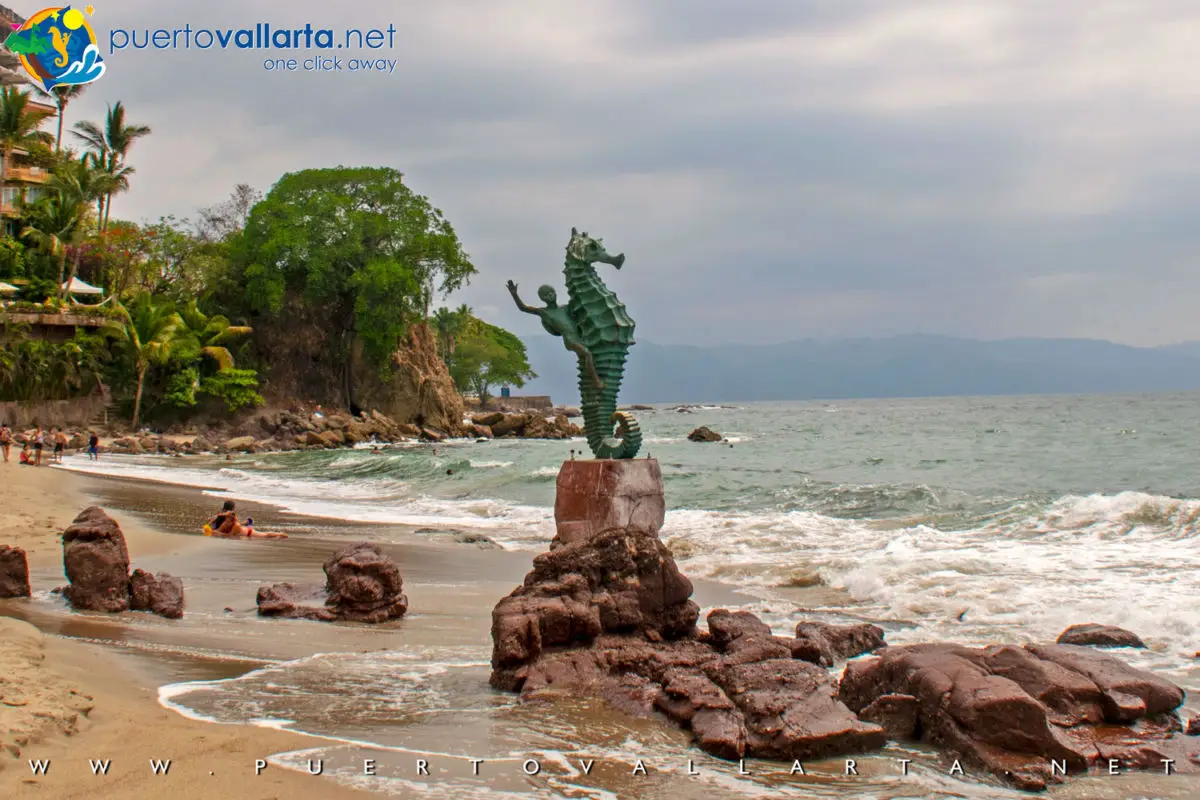
Playa Camarones downtown Puerto Vallarta
Graphs
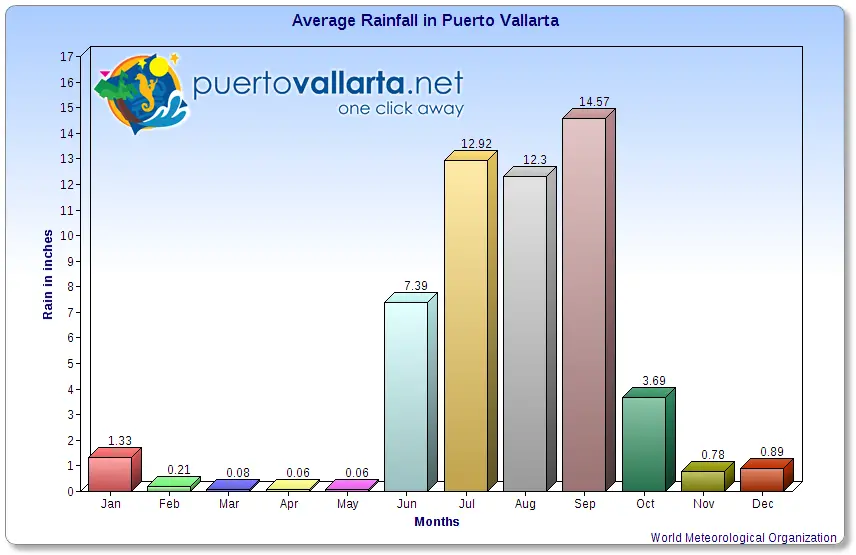
Precipitation per month in Puerto Vallarta
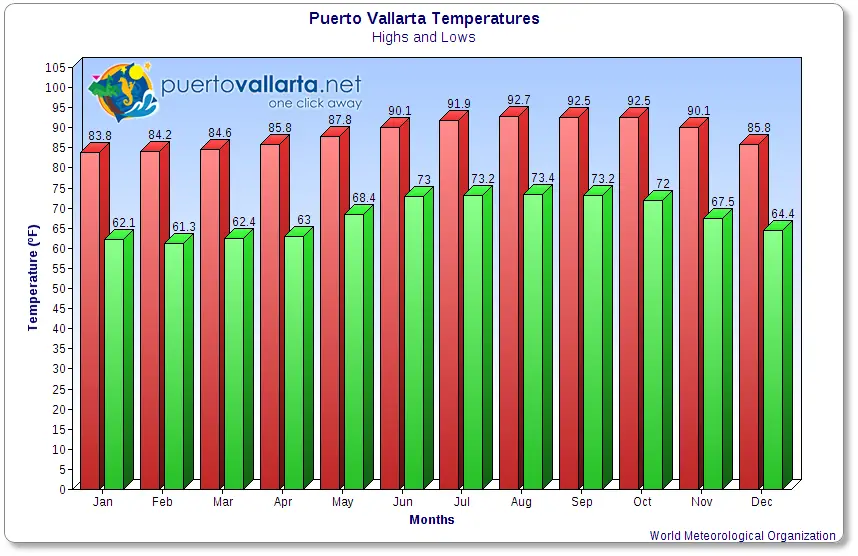
Average Puerto Vallarta temperatures °F
PV Weather Webcam

Puerto Vallarta Hurricanes
Puerto Vallarta Hurricanes Book a Puerto Vallarta tour Most days in Vallarta are sunny. Plan a day out with a local operator. Whale Watching Tour at CatamaranSee humpback whales in the bay, December to MarchSee dates and book Discover Puerto…
FAQ
The absolute best time for perfect weather is from late November through April. During these months, the humidity drops, the skies are bright blue, and temperatures comfortably hover in the mid 70s to low 80s (Fahrenheit), making it ideal for outdoor excursions.
No. A common misconception about the Puerto Vallarta rainy season is that it ruins vacations. In reality, the mornings and early afternoons are usually clear and hot. The rain typically arrives as passing tropical thunderstorms in the late afternoon.
Yes! The Pacific Ocean water is warm enough for swimming year round. In the winter, water temperatures average about 75 to 79 degrees Fahrenheit (24 to 26 degrees Celsius), and in late summer they reach a bath like 86 degrees Fahrenheit (30 degrees Celsius).

Book tours & support us
- Best prices
- 100% Local Support
- 2 decades+ of experience in Puerto Vallarta
Puerto Vallarta news, tips & content
- New info every two weeks
- Free content, news, videos
- Unsubscribe at any time

Contact us via WhatsApp
- Talk with our reservations expert
- Real local and human support
- Book tours, hotels, transfers, and more.
Share this article, choose your favorite option!


Frequently asked questions
For most people, November through April is the sweet spot: sunny, dry days, warm water and cooler evenings. December through March also brings humpback whales into the bay. If you don’t mind heat, humidity and afternoon storms, summer and early fall offer lower prices, fewer crowds and a lush green landscape.
The rainy season runs roughly from June through October, with July, August and September the wettest months. Rain usually arrives as a strong storm in the late afternoon or at night, so mornings are often sunny. It rarely rains all day.
Rarely. A typical rainy season day starts sunny and hot, clouds build over the mountains in the afternoon, and a heavy storm rolls through in the evening or at night. You can usually plan beach time and tours for the morning.
December is one of the nicest months: dry, sunny days with average highs of about 26 °C (78 °F) and nights of about 19 °C (65 °F), which can feel cooler with breezes coming off the Sierra Madre. The sea averages about 26 °C (79 °F), so swimming and snorkeling are comfortable. Humidity is much lower than in summer, and a light sweater or long sleeves can be welcome at night, especially on a boat or in the mountains.
July and August are the hottest months, with average highs around 29 °C (85 °F) and high humidity, and downtown on a still afternoon can feel hotter. The heat combined with humidity can feel intense, so plan outdoor activities early in the day.
Late summer and early fall, usually September and October, tend to be the quietest and cheapest months, with lower hotel rates and fewer crowds. The trade-off is heat, humidity, rain and the peak of hurricane season.
High season runs roughly from mid November through April, with the busiest weeks around Christmas, New Year, and Easter (Semana Santa). Book hotels and popular tours early if you plan to visit then.
More things to do nearby
Partner offers from GetYourGuide. We may earn a commission.